Theory of Demand
Demand is willingness (desire) and the ability to buy a certain quantity of a
commodity at the going price at a specific period of time.
commodity at the going price at a specific period of time.
Condition for effective Demand
- Willingness to buy
- Ability to buy
- Specific period of time
- Given price level
- Community
Demand Schedule and Curves
Draw demand schedule and curves
DEMAND SCHEDULE:
A table that illustrates the alternative quantities of a commodity demanded at different prices. A demand schedule is a simple means of summarizing information about demand price and quantity demanded for a
particular good. It is used to highlight the law of demand. It can also
be used to derive a demand curve.
particular good. It is used to highlight the law of demand. It can also
be used to derive a demand curve.
A demand schedule is a useful set of information that can summarize several of the more important aspects of demand.
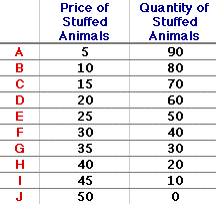
Setting up the Table
The
table in this exhibit displays the Shady Valley demand schedule for
stuffed Yellow Tarantulas, a cute and cuddly stuffed creature from the
Wacky Willy Stuffed Amigos line of collectibles.
table in this exhibit displays the Shady Valley demand schedule for
stuffed Yellow Tarantulas, a cute and cuddly stuffed creature from the
Wacky Willy Stuffed Amigos line of collectibles.
This
table contains three columns. The first contains reference labels A, B,
C, etc. for each price-quantity pair. The second is the demand price,
ranging from $5 to $50. And the third is the quantity demanded, ranging
from 0 to 90 Yellow Tarantulas. This schedule assumes other ceteris
paribus factors remain unchanged and that the quantities are those
demanded during a one year time period
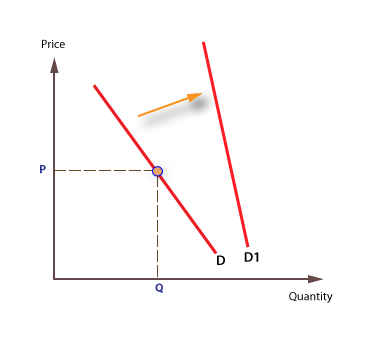
Demand curve, in
economics, a graphic representation of the relationship between product
price and the quantity of the product demanded. It is drawn with price
on the vertical axis of the graph and quantity demanded on the
horizontal axis. With few exceptions, the demand curve is delineated as
sloping downward from left to right because price and quantity demanded
are inversely related (i.e., the lower the price of a product, the
higher the demand or number of sales). This relationship is contingent
on certain ceteris paribus (other things equal) conditions
remaining constant. Such conditions include the number of consumers in
the market, consumer tastes or preferences, prices of substitute goods,
consumer price expectations, and personal income. A change in one or
more of these conditions causes a change in demand, which is reflected
by a shift in the location of the demand curve. A shift to the left
indicates a decrease in demand
THE LAW OF DEMAND
The
law of demand is amicroeconomic law that states, all other factors
being equal, as the price of a good or service increases, consumer
demand for the good or service will decrease, and vice versa. The law of
demand says that the higher the price, the lower the quantity demanded,
because consumers’ opportunity cost to acquire that good or service
increases, and they must make more tradeoffs to acquire the more
expensive product.
ASSUMPTIONS OF THE LAW OF DEMAND
- No change in habits, customs and income of consumers:
Law of demand tells us that demand goes with a fall in price and goes
down with a rise in price. But an increase in price will not bring down
the demand if at the same time the income of the buyer has also
increased. - This law does not apply on necessaries of life:
It is assumed that this law is not applicable in the case of
necessaries of life. Because, an increase in the price of flour will not
bring down its demand. Likewise a fall in its price will not vary much
increase the demand for it. - Joint demand: Goods
which have joint demand also falsify the law. Thus, an increase in the
demand of cars will lead to more demand for petrol. Whereas the law of
demand states that the demand for petrol should increase on it its price
falls. - Articles of distinction: Law of demand
does not hold goods in case of those goods which confer social
distinction. When the price of such goods goes up, their demand shall
also increase. For instance, an increase in the price of diamond will
raise its demand and a fall in price will lower the demand. - Fear of shortage in future:
If there is a fear of shortage of a good in future its demand will
increase in present as people would start storing. But according to law
of demand its demand should go it when its price falls. - Change in the price of substitutes:
This law does not apply in the case of tea and coffee, because these
goods are substitutes of each other. When the price of coffee goes up
the demand for tea shall increase although there has been no fall in the
price of tea. - Fear of a rise in price in future:
If consumers think that the price of particular goods will increase in
future, they will store it. In other words, the demand of those goods
shall increase at the same price. But this law states that demand should
go up only if price falls. - Ignorance: It is
possible that a consumer may not be aware of the previous price of a
good. In this case consumer might start purchasing more of a commodity
when its price has actually gone up. A new approach called the ordinal
utility approach, developed by Edgeworth, Pareto. Slutsky, Johnson,
Hicks and Allen are easier and more helpful in solving the problem of
consumer’s demand. The ordinal theory not only requires fewer
assumptions but possesses greater predictive power than does its
cardinal cousin.
The
assumption of cardinally measurable utility has been dispensed with not
because utility is not cardinally measurable, but simply because such
measurement is not at all required for analyzing consumer’s behaviour.
The points of distinction between the cardinal and the ordinal measures
of utility.
assumption of cardinally measurable utility has been dispensed with not
because utility is not cardinally measurable, but simply because such
measurement is not at all required for analyzing consumer’s behaviour.
The points of distinction between the cardinal and the ordinal measures
of utility.
Exception of the law of demand:
The
law of demand does not apply in every case and situation. The
circumstances when the law of demand becomes ineffective are known as
exceptions of the law. Some of these important exceptions are as under.
law of demand does not apply in every case and situation. The
circumstances when the law of demand becomes ineffective are known as
exceptions of the law. Some of these important exceptions are as under.
- Giffen goods:
Some special varieties of inferior goods are termed as Giffen goods.
Cheaper varieties of this category like bajra, cheaper vegetable like
potato come under this category. Sir Robert Giffen or Ireland first
observed that people used to spend more their income on inferior goods
like potato and less of their income on meat. But potatoes constitute
their staple food. When the price of potato increased, after purchasing
potato they did not have so many surpluses to buy meat. So the rise in
price of potato compelled people to buy more potato and thus raised the
demand for potato. This is against the law of demand. This is also known
as Giffen paradox. - Conspicuous Consumption:
This exception to the law of demand is associated with the doctrine
propounded by Thorsten Veblen. A few goods like diamonds etc are
purchased by the rich and wealthy sections of the society. The prices of
these goods are so high that they are beyond the reach of the common
man. The higher the price of the diamond the higher the prestige value
of it. So when price of these goods falls, the consumers think that the
prestige value of these goods comes down. So quantity demanded of these
goods falls with fall in their price. So the law of demand does not hold
good here. - Conspicuous necessities: Certain
things become the necessities of modern life. So we have to purchase
them despite their high price. The demand for T.V. sets, automobiles and
refrigerators etc. has not gone down in spite of the increase in their
price. These things have become the symbol of status. So they are
purchased despite their rising price. These can be termed as “U” sector
goods. - Ignorance: A consumer’s ignorance is
another factor that at times induces him to purchase more of the
commodity at a higher price. This is especially so when the consumer is
haunted by the phobia that a high-priced commodity is better in quality
than a low-priced one. - Emergencies: Emergencies
like war, famine etc. negate the operation of the law of demand. At
such times, households behave in an abnormal way. Households accentuate
scarcities and induce further price rises by making increased purchases
even at higher prices during such periods. During depression, on the
other hand, no fall in price is a sufficient inducement for consumers to
demand more. - Future changes in prices:
Households also act speculators. When the prices are rising households
tend to purchase large quantities of the commodity out of the
apprehension that prices may still go up. When prices are expected to
fall further, they wait to buy goods in future at still lower prices. So
quantity demanded falls when prices are falling. - Change in fashion:
A change in fashion and tastes affects the market for a commodity. When
a broad toe shoe replaces a narrow toe, no amount of reduction in the
price of the latter is sufficient to clear the stocks. Broad toe on the
other hand, will have more customers even though its price may be going
up. The law of demand becomes ineffective.
Factors which Determine the Strength of Demand (Causes for Demand Changes)
Point the factors which determine the strength of demand (causes for demand changes)
The following are the factors which determine demand for goods:
- Tastes and Preferences of the Consumers:
An important factor which determines demand for a good is the tastes
and preferences of the consumers for it. A good for which consumers’
tastes and preferences are greater, its demand would be large and its
demand curve will lie at a higher level. People’s tastes and preferences
for various goods often change and as a result there is change in
demand for them. The changes in demand for various goods occur due to
the changes in fashion and also due to the pressure of advertisements by
the manufacturers and sellers of different products. For example, a
few years back when Coca Cola plant was established in New Delhi demand
for it was very small. But now people’s taste for Coca Cola has
undergone a change and become favourable to it because of large
advertisement and publicity done for it. The result of this is that the
demand for Coca-Cola has increased very much. In economics we would say
that the demand curve For Coca Cola has shifted upward. On the contrary
when any good goes out of fashion or people’s tastes and preferences no
longer remain favourable to it the demand for it decreases. In economics
we say that the demand curve for these goods will shift downward. - Incomes of the People:
The demand for goods also depends upon incomes of the people. The
greater the incomes of the people the greater will be their demand for
goods. In drawing a demand schedule or a demand curve for a good we take
incomes of the people as given and constant. When as a result of the
rise in incomes of the people, the demand increases, the whole of the
demand curve shifts upward and vice versa. The greater income means the
greater purchasing power. Therefore, when incomes of the people
increase, they can afford to buy more. It is because of this reason that
the increase in income has a positive effect on the demand for a good.
When the incomes of the people fall they would demand less of the goods
and as a result the demand curve will shift below. For instance, during
the planning period in India the incomes of the people have greatly
increased owing to the large investment expenditure on the development
schemes by the Government and the private sector. As a result of this
increase in incomes, demand for food-grains has greatly increased which
has resulted in rightward shift in the demand curve for them. Likewise,
when because of drought in a year the agricultural production greatly
falls, incomes of the farmers decline. As a result of the decline in
incomes of the farmers, they demand less of cotton cloth and other
manufactured products. - Changes in the Prices of the Related Goods:
The demand for a good is also affected by the prices of other goods,
especially those which are related to it as substitutes or complements.
When we draw a demand schedule or a demand curve for a good we take the
prices of the related goods as remaining constant. Therefore, when the
prices of the related goods, substitutes or complements, change the
whole demand curve would change its position; it will shift upward or
downward as the case may be. When price of a substitute for a good
falls, the demand for that good will decline and when the price of the
substitute rises, the demand for that good will increase. For example,
when price of the tea as well as the incomes of the people remains the
same but price of the coffee falls, the consumers would demand less of
tea than before. Tea and coffee are very close substitutes, therefore
when coffee becomes cheaper, the consumers substitute coffee for tea and
as a result the demand for tea declines. The goods which are
complementary with each other, the change in the price of any of them
would affect the demand of the other. For instance, if price of the milk
falls, the demand for sugar would also be affected. When people would
take more milk or would prepare more khoya, burfi, rasgullas with milk;
the demand for sugar will also increase. Likewise, when price of cars
falls, the demand for them will increase which in turn will increase the
demand for petrol Cars and petrol are complementary with each other. - The Number of Consumers in the Market:
We have already explained that the market demand for a good is obtained
by adding up the individual demands of the present as well as
prospective consumers or buyers of a good at various possible prices.
The greater the number of consumers of a good, the greater the market
demand for it. Now, the question arises on what factors the number of
consumers of a good depends. If the consumers substitute one good for
another, then the number of consumers of that good which has been
substituted by the other will decline and for the good which has been
used in its place, the number of consumers will increase. Besides, when
the seller of a good succeeds in finding out new markets for his good
and as a result the market for his good expands the number of consumers
of that good will increase. Another Important cause for the increase in
the number of consumers is the growth in population. For instance, in
India the demand for many essential goods, especially food-grains, has
increased because of the increase in the population of the country and
the resultant increase in the number of consumers for them. - Changes in Propensity to Consume:
People’s propensity to consume also affects the demand for them. The
income of the people remaining constant, if their propensity to consume
rises, then out of the given income they would spend a greater part of
it with the result that the demand for goods will increase. On the other
hand, if propensity to save of the people increases, that is, if
propensity to consume declines, then the consumers would spend a smaller
part of their income on goods with the result that the demand for goods
will decrease. It is thus clear that with income remaining constant,
change in propensity to consume of the people will bring about a change
in the demand for goods. - Consumers’ Expectations with regard to Future Prices:
Another factor which influences the demand for goods is consumers’
expectations with regard to future prices of the goods. If due to some
reason, consumers expect that in the near future prices of the goods
would rise, then in the present they would demand greater quantities of
the goods so that in the future they should not have to pay higher
prices. Similarly, when the consumers hope that in the future they will
have good income, then in the present they will spend greater part of
their incomes with the result that their present demand for goods will
increase. - Income Distribution: Distribution of
income in a society also affects the demand for goods. If distribution
of income is more equal, then the propensity to consume of the society
as a whole will be relatively high which means greater demand for goods.
On the other hand, if distribution of income is more unequal, then
propensity to consume of the society will be relatively less, for the
propensity to consume of the rich people is less than that of the poor
people. Consequently with more unequal distribution of income, the
demand for consumer goods will be comparatively less. This is the effect
of the income distribution on the propensity to consume and demand for
goods. But the change in the distribution of income in the society would
affect the demand for various goods differently. If progressive taxes
are levied on the rich people and the money so collected is spent on
providing employment to the poor people, the distribution of income
would become more equal and with this there would be a transfer of
purchasing power from the rich to the poor. As a result of this, the
demand for those goods will increase which are generally purchased by
the poor because the purchasing power of the poor people has increased
and, on the other hand, the demand for those goods will decline which
are usually consumed by the rich on whom progressive taxes have been
levied.
FACTORS FOR CHANGE IN DEMAND
- Tastes and preferences of the consumer:
Tastes include fashion, habit, customs etc. A good for which consumers
tastes and preferences are greater claim higher demand. Thus the demand
curve lies at a higher level. With the change in consumer’s taste and
preference for particular commodity the demand for that commodity
declines. If the taste goes up its amount demanded becomes high even at a
high price. Those goods which go out of fashion of people no longer
remains attractive to them. So the demand for them decreases. - Income of the people:
The demand for goods depends upon the income of the people. There is
direct relation between income and demand for immodesties. A rise in
income gives rise to greater purchasing power. Thus increase in income
has a positive effect for a good. With a rise and fall in income the
demand curve shifts upward and downward respectively. But in case of
giffen goods the income effect is negative. - Changes in prices of the related goods:
The demand for a commodity is affected by the changes in the prices of
other related commodities. The related commodities may be (i) substitute
and (ii) complementary. A commodity is said to be substitute only when
it yields the same utility and satisfaction in place of other.
Complementary goods are jointly demanded. They are consumed untidily for
satisfaction. Tea and coffee are substitute’s goods but pen and ink are
complementary commodities. When the price of a substitute of a good
falls the demand for that good declines and when the price of the
substitute rises, the demand for that good increases. In case of
complementary goods there is opposite relationship between price of one
commodity and the amount demanded for the other. The effect in change in
price of related goods on the amount demanded is called as Gross
Demand. - Future expectation: Present demand for a
commodity also depends on the future expectation of the change in
price. If people expect that the price of a commodity will rise in
future, they will buy more even at a high price so as to escape the
further rise in price in future. Similarly any expectation of the fall
in price in future will diminute demand for a commodity as people expect
further fall in price. Similarly if buyers expect their incomes to rise
in future, they may increase the present demand. - Population:
Rise of population also gives rise to demand for necessaries of life.
The composition and size of population affect the demand. With high
birth rate demand for milk food, medicines and garments increase. The
rise in the proportion of adult, old and woman also shape the nature of
demand accordingly. - Income distribution: Income
distribution in the society affects the demand for goods. If the
distribution of income is even then the demand for goods is greater. On
the other hand if the distribution of income is unequal, the demand for
consumer goods will be comparatively less.
Elasticity of Demand
Define elasticity of demand
The
degree to which demand for a good or service varies with its price.
Normally, sales increase with drop in prices and decrease with rise in
prices. As a general rule, appliances, cars, confectionary and other
non-essentials show elasticity of demand whereas most necessities (food,
medicine, basic clothing) show inelasticity of demand (do not sell
significantly more or less with changes in price).
Price elasticity of demand
Price
elasticity of demand (PED) shows the relationship between price and
quantity demanded and provides a precise calculation of the effect of a
change in price on quantity demanded.
elasticity of demand (PED) shows the relationship between price and
quantity demanded and provides a precise calculation of the effect of a
change in price on quantity demanded.
The following equation enablesPED to be calculated.

We
can use this equation to calculate the effect of price changes on
quantity demanded, and on the revenue received by firms before and after
any price change.
can use this equation to calculate the effect of price changes on
quantity demanded, and on the revenue received by firms before and after
any price change.
Problem: Yesterday,
the price of envelopes was $3 a box, and Julie was willing to buy 10
boxes. Today, the price has gone up to $3.75 a box, and Julie is now
willing to buy 8 boxes. Is Julie’s demand for envelopes elastic or
inelastic? What is Julie’s elasticity of demand?
the price of envelopes was $3 a box, and Julie was willing to buy 10
boxes. Today, the price has gone up to $3.75 a box, and Julie is now
willing to buy 8 boxes. Is Julie’s demand for envelopes elastic or
inelastic? What is Julie’s elasticity of demand?
To
find Julie’s elasticity of demand, we need to divide the percent change
in quantity by the percent change in price. <!– [if
!supportLineBreakNewLine]–> <!–[endif]–>
find Julie’s elasticity of demand, we need to divide the percent change
in quantity by the percent change in price. <!– [if
!supportLineBreakNewLine]–> <!–[endif]–>
- % Change in Quantity = (8 – 10)/(10) = -0.20 = -20%
- %Change in Price = (3.75 – 3.00)/(3.00) = 0.25 = 25%
- Elasticity = |(-20%)/(25%)| = |-0.8| = 0.8
Her
elasticity of demand is the absolute value of -0.8, or 0.8. Julie’s
elasticity of demand is inelastic, since it is less than 1.
elasticity of demand is the absolute value of -0.8, or 0.8. Julie’s
elasticity of demand is inelastic, since it is less than 1.
Problem : If
Neil’s elasticity of demand for hot dogs is constantly 0.9, and he buys
4 hot dogs when the price is $1.50 per hot dog, how many will he buy
when the price is $1.00 per hot dog?
Neil’s elasticity of demand for hot dogs is constantly 0.9, and he buys
4 hot dogs when the price is $1.50 per hot dog, how many will he buy
when the price is $1.00 per hot dog?
This
time, we are using elasticity to find quantity, instead of the other
way around. We will use the same formula, plug in what we know, and
solve from there. <!– [if !supportLineBreakNewLine]–>
<!–[endif]–>
time, we are using elasticity to find quantity, instead of the other
way around. We will use the same formula, plug in what we know, and
solve from there. <!– [if !supportLineBreakNewLine]–>
<!–[endif]–>
- Elasticity =
- And, in the case of John, %Change in Quantity = (X – 4)/4
- Therefore :
- Elasticity = 0.9 = |((X – 4)/4)/(% Change in Price)|
- % Change in Price = (1.00 – 1.50)/(1.50) = -33%
- 0.9 = |(X – 4)/4)/(-33%)|
- |((X – 4)/4)| = 0.3
- 0.3 = (X – 4)/4
- X = 5.2 <!– [if !supportLineBreakNewLine]–> <!–[endif]–>
Since
Neil probably can’t buy fractions of hot dogs, it looks like he will
buy 5 hot dogs when the price drops to $1.00 per hot dog.
Neil probably can’t buy fractions of hot dogs, it looks like he will
buy 5 hot dogs when the price drops to $1.00 per hot dog.
Problem : Which
of the following goods are likely to have elastic demand, and which are
likely to have inelastic demand? <!– [if
!supportLineBreakNewLine]–> <!–[endif]–>
of the following goods are likely to have elastic demand, and which are
likely to have inelastic demand? <!– [if
!supportLineBreakNewLine]–> <!–[endif]–>
- Home heating oil
- Pepsi
- Chocolate
- Water
- Heart medication
- Oriental rugs
- Elastic demand: Pepsi, chocolate, and Oriental rugs
- Inelastic demand: Home heating oil, water, and heart medication
Problem: If supply is unit elastic and demand is inelastic, a shift in which curve would affect quantity more? Price more?
Shifting the demand curve would affect quantity more, and shifting the supply curve would affect price more.
Problem: Katherine
advertises to sell cookies for $4 a dozen. She sells 50 dozen, and
decides that she can charge more. She raises the price to $6 a dozen and
sells 40 dozen. What is the elasticity of demand? Assuming that the
elasticity of demand is constant, how many would she sell if the price
were $10 a box?
advertises to sell cookies for $4 a dozen. She sells 50 dozen, and
decides that she can charge more. She raises the price to $6 a dozen and
sells 40 dozen. What is the elasticity of demand? Assuming that the
elasticity of demand is constant, how many would she sell if the price
were $10 a box?
To
find the elasticity of demand, we need to divide the percent change in
quantity by the percent change in price. <!– [if
!supportLineBreakNewLine]–> <!–[endif]–>
find the elasticity of demand, we need to divide the percent change in
quantity by the percent change in price. <!– [if
!supportLineBreakNewLine]–> <!–[endif]–>
- % Change in Quantity = (40 – 50)/(50) = -0.20 = -20%
- % Change in Price = (6.00 – 4.00)/(4.00) = 0.50 = 50%
- Elasticity = |(-20%)/(50%)| = |-0.4| = 0.4 <!– [if !supportLineBreakNewLine]–> <!–[endif]–>
The elasticity of demand is 0.4 (elastic). <!– [if !supportLineBreakNewLine]–> <!–[endif]–>
To
find the quantity when the price is $10 a box, we use the same formula:
<!– [if !supportLineBreakNewLine]–> <!–[endif]–>
find the quantity when the price is $10 a box, we use the same formula:
<!– [if !supportLineBreakNewLine]–> <!–[endif]–>
- Elasticity = 0.4 = |(% Change in Quantity)/(% Change in Price)|
- % Change in Price = (10.00 – 4.00)/(4.00) = 1.5 = 150% <!– [if !supportLineBreakNewLine]–> <!–[endif]–>
Remember
that before taking the absolute value, elasticity was -0.4, so use -0.4
to calculate the changes in quantity, or you will end up with a big
increase in consumption, instead of a decrease! <!– [if
!supportLineBreakNewLine]–> <!–[endif]–>
that before taking the absolute value, elasticity was -0.4, so use -0.4
to calculate the changes in quantity, or you will end up with a big
increase in consumption, instead of a decrease! <!– [if
!supportLineBreakNewLine]–> <!–[endif]–>
- -0.4 = |(% Change in Quantity)/(150%)|
- |(%Change in Quantity)| = -60% =
- -0.6 -0.6 = (X – 50)/50
- X = 20 <!– [if !supportLineBreakNewLine]–> <!–[endif]–>
The new demand at $10 a dozen will be 20 dozen cookies.
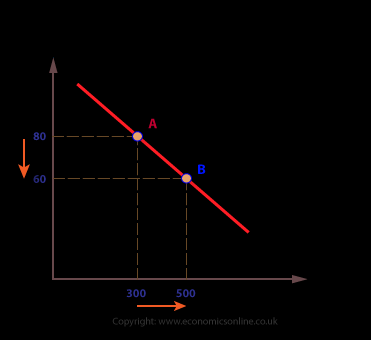
For
example, if the price of a daily newspaper increases from £1.00 to
£1.20p, and the daily sales fall from 500,000 to 250,000, the PED will
be:
example, if the price of a daily newspaper increases from £1.00 to
£1.20p, and the daily sales fall from 500,000 to 250,000, the PED will
be:
- – 50%/ + 20%
- = (-) 2.5
The
negative sign indicates that P and Q are inversely related, which we
would expect for most price/demand relationships. This is significant
because the newspaper supplier can calculate or estimate how revenue
will be affected by the change in price. In this case, revenue at £1.00
is £500,000 (£1 x 500,000) but falls to £300,000 after the price rise
(£1.20 x 250,000).
The range of responses
The
degree of response of quantity demanded to a change in price can vary
considerably. The key benchmark for measuring elasticity is whether the
co-efficient is greater or less than proportionate. If quantity demanded
changes proportionately, then the value of PED is 1, which is called
‘unit elasticity’.
PED can also be:
- Less than one, which means PED is inelastic.
- Greater than one, which is elastic.
- Zero (0), which is perfectly inelastic.
- Infinite (∞), which is perfectly elastic.
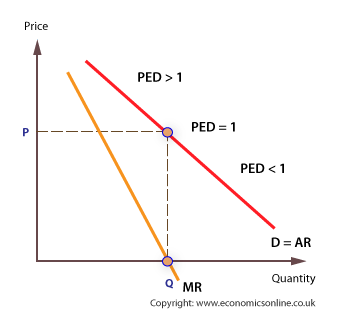
PED along a linear demand curve
PED
on a linear demand curve will fall continuously as the curve slopes
downwards, moving from left to right. PED = 1 at the midpoint of a
linear demand curve.
on a linear demand curve will fall continuously as the curve slopes
downwards, moving from left to right. PED = 1 at the midpoint of a
linear demand curve.
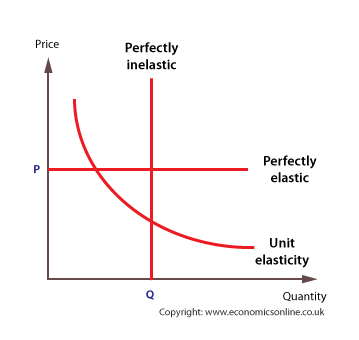
Five cases of Elasticity of Demand:
- Perfectly elastic demand
- Perfectly inelastic demand
- Relatively elastic demand
- Relatively inelastic demand
- Unitary elastic demand
- Perfectly elastic demand:
The demand is said to be perfectly .elastic when a very insignificant
change in price leads to an infinite change in quantity demanded. A very
small fall in price causes demand to rise infinitely. Likewise a very
insignificant rise in price reduces the demand to zero. This case is
theoretical which is never found in real life. - Perfectly inelastic demand:
The demand is said to be perfectly inelastic when a change in price
produces no change in the quantity demanded of a commodity. In such a
case quantity demanded remains constant regardless of change in price.
The amount demanded is totally unresponsive of change in price. The
elasticity of demand is said to be zero. - Relatively more elastic demand:
The demand is relatively more elastic when a small change in price
causes a greater change in quantity demanded. In such a case a
proportionate change in price of a commodity causes more than
proportionate change in quantity demanded. If price changes by 10% the
quantity demanded of the commodity change by more than 10% i.e. 25%. The
demand curve in such a situation is relatively flatter. - Relatively inelastic demand:
It is a situation where a greater change in price leads to smaller
change in quantity demanded. The demand is said to be relatively
inelastic when a proportionate change in price is greater than the
proportionate change in quantity demanded. For example If price falls by
20% quantity demanded rises by less than 20% i.e 15%. - Unitary elastic demand:
The demand is said to be unit when a change in price produces exactly
the same percentage change in the quantity demanded of a commodity. In
such a situation the percentage change in both the price and quantity
demanded is the same. For example if the price falls by 25% the quantity
demanded rises by the same 25%. It takes the shape of a rectangular
hyperbola. Numerically elasticity of demand is said to be equal to 1.(ed
= 1).
There is a precise mathematical connection between PED and a firm’s revenue.
There are three ‘types’ of revenue:
- Total revenue (TR), which is found by multiplying price by quantity sold (P x Q).
- <!–[endif]–>Average
revenue (AR), which is found by dividing total revenue by quantity sold
(TR/Q). Consider these figures and calculate Total, Marginal and
Average Revenue. - <!–[endif]–>Marginal revenue (MR),
which is defined as the revenue from selling one extra unit. This is
calculated by finding the change in TR from selling one more unit.
| PRICE (£) | Qd | TR | MR | AR |
| 10 | 1 | – | – | – |
| 9 | 2 | – | – | – |
| 8 | 3 | – | – | – |
| 7 | 4 | – | – | – |
| 6 | 5 | – | – | — |
| 5 | 6 | – | – | – |
| 4 | 7 | – | – | – |
| 3 | 8 | – | – | – |
| 2 | 9 | – | – | — |
| 1 | 10 | – | – | – |
Answer
Study
the patterns of numbers and see if you can analyse the relationships
between the three measures of revenue – then answer the following:
the patterns of numbers and see if you can analyse the relationships
between the three measures of revenue – then answer the following:
- How are price and average revenue connected?
- What happens to total revenue as output increases?
- What is the connection between total revenue and marginal revenue?
- How are marginal revenue and average revenue connected?
Observations
When TR is at a maximum, MR = zero, and PED = 1.
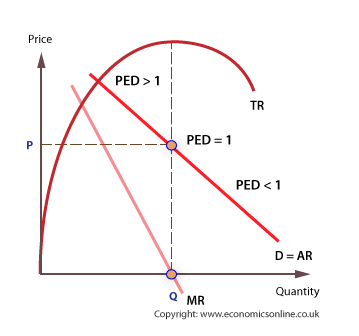
- Price and AR are identical, because AR = TR/Q, which is P x Q/Q, and cancel out the Qs to get P.
- A curve plotting AR (=P) against Q is also a firm’s demand curve.
- TR increases, reaches a peak and decreases.
Why does a firm want to know PED?
There
are several reasons why firms gather information about the PED of its
products. A firm will know much more about its internal operations and
product costs than it will about its external environment. Therefore,
gathering data on how consumers respond to changes in price can help
reduce risk and uncertainly. More specifically, knowledge of PED can
help the firm forecast its sales and set its price.
- Sales forecasting;
The firm can forecast the impact of a change in price on its sales
volume, and sales revenue (total revenue, TR). For example, if PED for a
product is (-) 2, a 10% reduction in price (say, from £10 to £9) will
lead to a 20% increase in sales (say from 1000 to 1200). In this case,
revenue will rise from £10,000 to £10,800. - Pricing policy;
Knowing PED helps the firm decide whether to raise or lower price, or
whether to price discriminate. Price discrimination is a policy of
charging consumers different prices for the same product. If demand is
elastic, revenue is gained by reducing price, but if demand is
inelastic, revenue is gained by raising price. - Non-pricing policy; When PED is highly elastic, the firm can use advertising and other promotional techniques to reduce elasticity.
Determinants of PED
There are several reasons why consumers may respond elastically or inelastically to a price change, including:
- The number and ‘closeness’ of substitutes. A unique and desirable product is likely to exhibit an inelastic demand with respect to price.
- The degree of necessity of the good. A necessity like bread will be demanded in elastically with respect to price.
- Whether the good is habit forming. Consumers are also relatively insensitive to changes in the price of habitually demanded products.
- The proportion of consumer income which is spent on the good The PED for a daily newspaper is likely to be much lower than that for a new car!
- Whether consumers are loyal to the brand Brand. loyalty reduces sensitivity to price changes and reduces PED.
- Life cycle of product PED will vary according to where the product is in its life cycle.
When new products are launched, there are often very few competitors
and PED is relatively inelastic. As other firms launch similar products,
the wider choice increases PED. Finally, as a product begins to decline
in its lifecycle, consumers can become very responsive to price, hence
discounting is extremely common.
The effects of advertising
Firms may use persuasive advertising by to win new customers and retain the loyalty of existing ones.
Advertisers
use a range of media, including television, press, and electronic
media. Advertising will shift demand to the right, and make demand less
elastic.
use a range of media, including television, press, and electronic
media. Advertising will shift demand to the right, and make demand less
elastic.
There are three extreme cases of PED.
- Perfectly elastic, where only one price can be charged.
- Perfectly inelastic, where only one quantity will be purchased.
- Unit elasticity,
where all the possible price and quantity combinations are of the same
value. The resultant curve is called a rectangular hyperbola.
Factors that Determine Degree of Elasticity (Changes) of Demand
Identify the factors that determine degree of elasticity (changes) of demand
Various factors which affect the elasticity of demand of a commodity are:
- Nature of commodity:
Elasticity of demand of a commodity is influenced by its nature. A
commodity for a person may be a necessity, a comfort or a luxury. i.
When a commodity is a necessity like food grains, vegetables, medicines,
etc., its demand is generally inelastic as it is required for human
survival and its demand does not fluctuate much with change in price.
ii. When a commodity is a comfort like fan, refrigerator, etc., its
demand is generally elastic as consumer can postpone its consumption.
iii. When a commodity is a luxury like AC, DVD player, etc., its demand
is generally more elastic as compared to demand for comforts. iv. The
term ‘luxury’ is a relative term as any item (like AC), may be a luxury
for a poor person but a necessity for a rich person. - Availability of substitutes:
Demand for a commodity with large number of substitutes will be more
elastic. The reason is that even a small rise in its prices will induce
the buyers to go for its substitutes. For example, a rise in the price
of Pepsi encourages buyers to buy Coke and vice-versa. Thus,
availability of close substitutes makes the demand sensitive to change
in the prices. On the other hand, commodities with few or no substitutes
like wheat and salt have less price elasticity of demand. - Income Level:
Elasticity of demand for any commodity is generally less for higher
income level groups in comparison to people with low incomes. It happens
because rich people are not influenced much by changes in the price of
goods. But, poor people are highly affected by increase or decrease in
the price of goods. As a result, demand for lower income group is highly
elastic. - Level of price: Level of price also
affects the price elasticity of demand. Costly goods like laptop, Plasma
TV, etc. have highly elastic demand as their demand is very sensitive
to changes in their prices. However, demand for inexpensive goods like
needle, match box, etc. is inelastic as change in prices of such goods
do not change their demand by a considerable amount. - Postponement of Consumption:
Commodities like biscuits, soft drinks, etc. whose demand is not
urgent, have highly elastic demand as their consumption can be postponed
in case of an increase in their prices. However, commodities with
urgent demand like life saving drugs, have inelastic demand because of
their immediate requirement. - Number of Uses:
If the commodity under consideration has several uses, then its demand
will be elastic. When price of such a commodity increases, then it is
generally put to only more urgent uses and, as a result, its demand
falls. When the prices fall, then it is used for satisfying even less
urgent needs and demand rises. For example, electricity is a
multiple-use commodity. Fall in its price will result in substantial
increase in its demand, particularly in those uses (like AC, Heat
convector, etc.), where it was not employed formerly due to its high
price. On the other hand, a commodity with no or few alternative uses
has less elastic demand. - Share in Total Expenditure:
Proportion of consumer’s income that is spent on a particular commodity
also influences the elasticity of demand for it. Greater the proportion
of income spent on the commodity, more is the elasticity of demand for
it and vice-versa. Demand for goods like salt, needle, soap, match box,
etc. tends to be inelastic as consumers spend a small proportion of
their income on such goods. When prices of such goods change, consumers
continue to purchase almost the same quantity of these goods. However,
if the proportion of income spent on a commodity is large, then demand
for such a commodity will be elastic. 8. Time Period: Price elasticity
of demand is always related to a period of time. It can be a day, a
week, a month, a year or a period of several years. Elasticity of demand
varies directly with the time period. Demand is generally inelastic in
the short period. It happens because consumers find it difficult to
change their habits, in the short period, in order to respond to a
change in the price of the given commodity. However, demand is more
elastic in long rim as it is comparatively easier to shift to other
substitutes, if the price of the given commodity rises. 9. Habits:
Commodities, which have become habitual necessities for the consumers,
have less elastic demand. It happens because such a commodity becomes a
necessity for the consumer and he continues to purchase it even if its
price rises. Alcohol, tobacco, cigarettes, etc. are some examples of
habit forming commodities. Finally it can be concluded that elasticity
of demand for a commodity is affected by number of factors. However, it
is difficult to say, which particular factor or combination of factors
determines the elasticity. It all depends upon circumstances of each
case.
Exercise 1
QUIZ
- State the law of law of demand and its assumption.
- Explain the factor that influencing the demand of a commodity.